
Να υπενθυμίσω ότι ήταν η μέρα που είχε γενέθλια η Ελισαύβρετ (lol), “έφαγαν” τον Pince, κατέρρευσε ο ποδηλατόδρομος στην πρωτεύουσα της Ατζέντα 21 και μόλις σήμερα ανακάλυψα ότι η Βραζιλία πλημμύρισε παρότι πλήττεται από ξηρασία.
Πολλές οι ενδείξεις ότι CERN έχει “κλέψει” από το ρόλο του HAARP και όχι μόνο. Το πολύ καλό άρθρο εξηγεί ακόμα, πως οι καλές δονήσεις Σούμαν διαταράχθηκαν και δεν είναι να απορεί κανείς γιατί νιώθαμε τόσο χάλια. Διαβάστε:
What CERN did, that you couldn’t see!
I finally was able to get into the hard drive off my computer that crashed two months ago and get my bookmarks- including the back door hack into CERN. This back door allows me to see the data from the live stream going back for 7 days, while the public feed only allows you to see for approx 24-36 hours.
For the past few days I’ve been watching CERN Very closely, and have noticed a few anomalies on the public feed, so I finally made a big effort to get my old links….. and what I just saw on CERN through the back door feed stretched out from 7 days is mind blowing and is NOT view-able on the public feed at all!
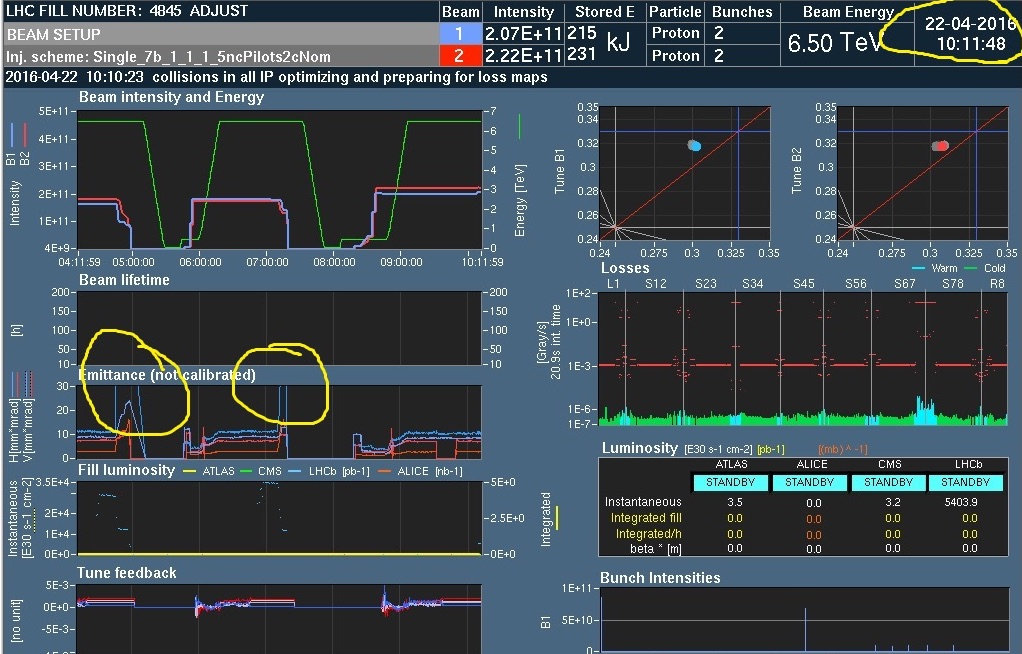
Here is the screen shot that I took April 22 via the public CERN Op Vistars web feed. Please note the time stamp of 10:11am, and that the Emittance has blown way off the charts twice.
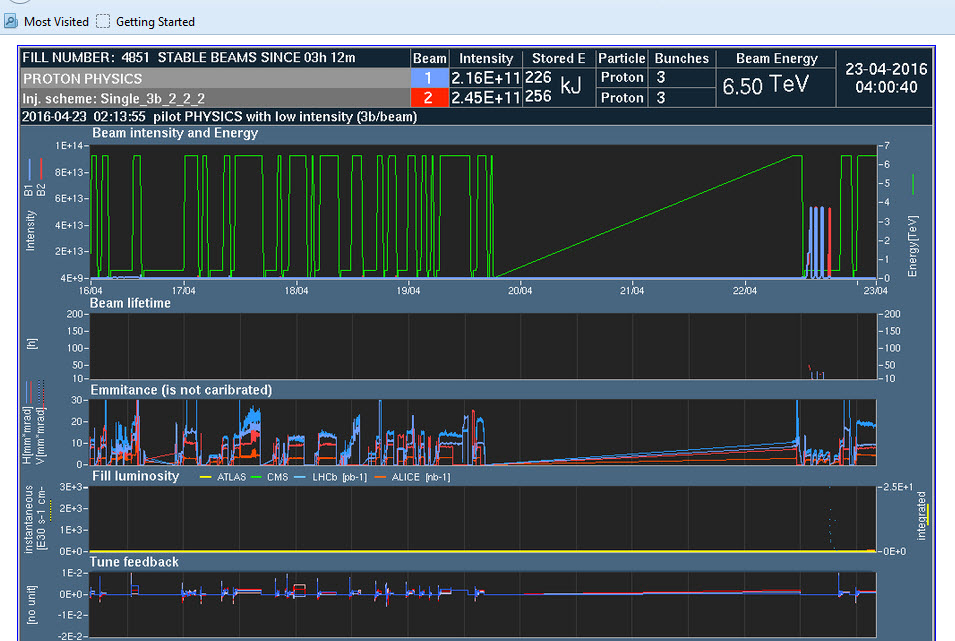
And here is the Screen Shot I just took of the CERN feed through the back door showing a 7 day feed. You can see that at approximate 8-9pm UTC that the power (the green line in the graph) begins to increase in a long slow momentum until it reaches it’s peak at approximately 12 noon on April 22. At no point during that 3 day period did this continuous increase in power show on the public website feed!!!!! You can also see that from the 15th to the 19th, the Emittance goes right off the chart several times, then follows the Energy green line increase to the 22nd, where at exactly the point that the power drops off, the Emittance again blows right off the chart.
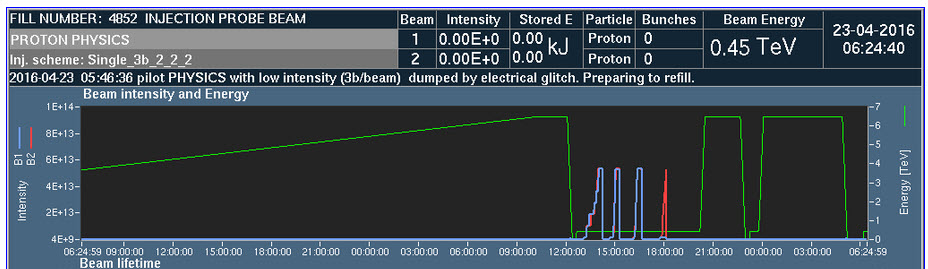
Here is a close up of the 2 day feed through the back door- notice that the green line doesn’t drop until AFTER noon on the 22nd and that the beams are not fired up again until sometime after 1pm. Yet the public feed (first image above) shows that the power and the beams are up and down all morning. This is absolute confirmation of what I have long suspected, that the public CERN OP-Vistars feed is just a fuckin’ Sham.


Δεν υπάρχουν σχόλια:
Δημοσίευση σχολίου
ΠΡΟΣΟΧΗ: Οι απόψεις των αναρτήσεων δεν ταυτίζονται υποχρεωτικά με τις δικές μας.
Σημείωση: Μόνο ένα μέλος αυτού του ιστολογίου μπορεί να αναρτήσει σχόλιο.